What the New NPCC Data Really Shows
The NPCC has released its first dataset of the 2026/27 reporting year and for the first time, forces are publishing grant and renewal performance separately.
This article breaks down a complex set of data into plain language. We keep it simple and focus on things that matter to the shooting community.
We’ll tell you about the big things and then talk about how your Forces measures up.
- Temporary Permit Ranking
- Revocation & Refusal Ranking
- Productivity Rating
- Grant Timeliness
These are the indicators that tell shooters what life is really like in each force area.
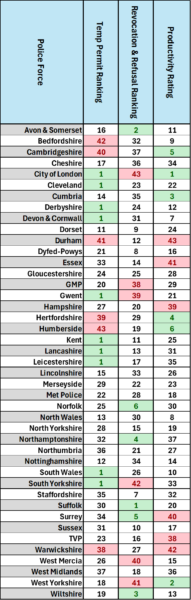
We rank each Force according to how it performs in these areas (1 best to 43 worst) to make it as easy as possible to compare against the others.
If Forces perform the same then they share the ranking. Approximately ten Forces all have no Temporary Permits. So they all share a ranking of 1 and Dorset is number 11.
The Big Picture – What Shooters Need to Know
When you combine all three metrics, the national picture becomes clear:
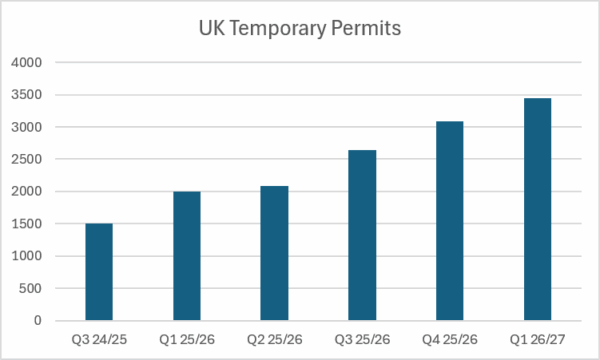
Temporary permits are now the clearest indicator of force health
Nationally numbers continue to increase. If you pay attention to only one set of numbers. These are the ones you should be looking at.
Nationally these are increasing at an alarming rate.
The reduction in numbers of Certificate Holders continues
A loss of approximately 40,000 since the start of 2025.
Some forces are genuinely excellent
Cheshire, Cumbria, Merseyside, Derbyshire, Lincolnshire, South Yorkshire, Kent, North Wales.
Some forces are under serious strain
Surrey, Sussex, Suffolk, Northumbria, Humberside, Bedfordshire, Cambridgeshire – these forces show high temporary permits, higher revocation/refusal rates, and lower productivity.
Collaboration areas consistently struggle
BCH, Surrey/Sussex, Norfolk/Suffolk, Staffs/WMP all perform poorly
Grant SLA finally exposes the truth
Renewals were masking delays. Now we can clearly see why it is so difficult for people to access the sport for the first time.
Temporary Permits
A temporary permit is usually issued when a force cannot complete your application in time.
Some forces issue almost none. Others issue hundreds.
The worst performers include:
- Humberside (43rd)
- Bedfordshire (42nd)
- Durham (41st)
- Cambridgeshire (40th)
- Hertfordshire (39th)
These forces are struggling to keep up with demand, and shooters in these areas should expect delays, slow grants, and a higher chance of being placed on a temporary permit.
At the other end of the scale, forces like Cleveland, Derbyshire, Kent, Lancashire, Leicestershire, South Wales, South Yorkshire issue almost none – a sign of stability and good workflow.
Revocations & Refusals
How likely is this to happen to you?
This metric shows how often a force revokes or refuses certificates relative to the number of holders it manages.
Some forces revoke or refuse far more often than others.
The highest‑risk forces include:
- South Yorkshire
- Greater Manchester Police
- Gwent (Although this rate is coming down)
- West Mercia
- West Yorkshire
The lowest‑risk forces include:
- Wiltshire
- Avon and Somerset
- Northamptonshire
In real terms of how likely you are to be refused or revoked. Shooters in:
South Yorkshire are 7.6× more likely
West Yorkshire are 6.5× more likely
West Mercia are 5× more likely
Than if they lived in Wiltshire.
Productivity
How much work gets done
Productivity is the closest thing shooters have to a real turnaround measure. It shows how many certificates a force processes in comparison to how many Holders it manages.
High productivity = fast turnaround. Low productivity = slow, backlog‑heavy workflow.
The fastest forces include:
- West Yorkshire
- Cumbria
- Derbyshire
The slowest include:
- Durham
- Warwickshire
- Surrey
- Essex
- Bedfordshire
This is where shooters feel the difference most – how long it actually takes to get a certificate in hand.
New Shooters
This table shows how many new applications each force completes within the official 4‑month target.
The big picture is simple: your postcode determines your wait time, and the gap between the best and worst forces is enormous.
Across England and Wales, a handful of forces are doing genuinely excellent work on new applications, consistently hitting the 4‑month SLA and giving shooters fast, predictable turnaround.
Cheshire, Merseyside, Derbyshire, Cumbria, Cleveland, Nottinghamshire, Dyfed‑Powys, South Yorkshire and Thames Valley stand out as the strongest performers.

The Final Table
Limitations and Manipulation
No data will ever be perfect. The police are limited by an archaic computer system that does not make it easy to produce and analyse this information.
The information provided and our analysis now gives shooters the opportunity to understand performance in a way that has never previously been possible.
BUT – There are a variety of ways in which this data is open to manipulation and the fact that each Force works differently makes it even more difficult.
Take BCH for example. There is no denying the progress that has been made with the reduction of their Temporary Permits but this data suggests that somewhere in the region of a third of BCH grants are being completed within 4 months.
On the basis of our considerable experience and evidence we have gathered it is difficult to believe that this is anything other than data manipulation. In this case a huge delay between receiving the application and it being entered into the system. The clock only starts once it is in the system.
References:
Analysis of this kind is fraught with issues. Any challenges, corrections or queries should be sent to info@firearmslicensing.net.
Any errors made are unintentional and those pointed out will be publicly corrected.
To see the data in full please visit –
https://www.npcc.police.uk/publications/All-publications/
and look in “Operations Coordination Committee”
This Quarter’s data in full is available here: