What the latest firearms licensing figures tell us
A national total can look reassuring. Sometimes it takes a closer look to see what is happening underneath it.
The latest NPCC figures show fewer certificate holders, a small national increase in temporary permits and a modest rise in completed files. But one team accounts for almost all that extra output, while its reduction in temporary permits conceals substantial increases elsewhere.
As before, we are looking at the things that matter to certificate holders and new applicants: temporary permits, refusals and revocations, how much work gets done, and how long grants take.
The national picture
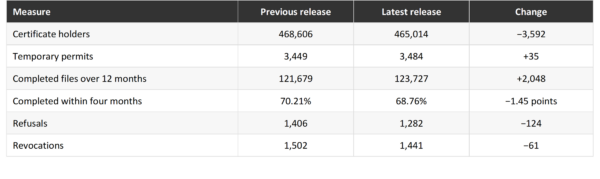
More completed files, but a smaller proportion completed within four months. Those measures answer different questions. We need both.
The certificate-holder total has fallen by another 3,592. The figures establish that net reduction; they do not tell us why each person ceased to hold a certificate.
Comparisons throughout are between releases. Application measures cover overlapping rolling 12-month periods, rather than work completed in two separate quarters.
Temporary Permits
The national total rose by just 35. On its own, that sounds like little has changed. Look beneath it and the picture is very different.
 Outside BCH, temporary permits increased by 23.3%. BCH’s reduction offsets almost 95% of that net increase elsewhere. Its progress deserves recognition, but it should not obscure growing reliance on temporary permits in other areas.
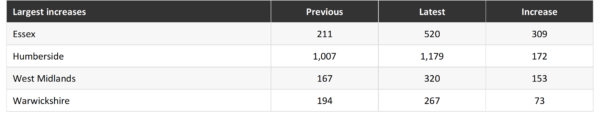
Essex more than doubled. West Midlands almost doubled. Humberside still holds the largest count, accounting for 33.8% of the national total. These three forces account for 76.1% of all additions in forces where permit counts increased.
These are recorded permit counts at each snapshot, not the number newly issued during the period. They are an important warning signal to investigate, rather than a complete explanation of the underlying delays.
Refusals and Revocations
Nationally, refusals fell 8.8% and revocations fell 4.1%. Together, they declined from 2,908 to 2,723. After allowing for the smaller holder population, the combined measure fell from 6.21 to 5.86 decisions per 1,000 holders.
South Yorkshire stands out at 17.74 per 1,000 holders, followed by West Yorkshire at 13.56 and West Mercia at 10.79. Nottinghamshire recorded a notable increase, from 8.70 to 10.71. Suffolk recorded 1.30.
These differences deserve examination. While they are not a league table of decision quality they raise serious questions.
Productivity
How much work gets done for the size of the population served?
Our measure divides completed grant and renewal files in the preceding 12 months by the number of certificate holders. We express the result as completed files per 100 holders.
This reduces dependence on the recorded receipt date that drives turnaround calculations. It does not make the data immune to recording problems, but gives us another way to examine output.
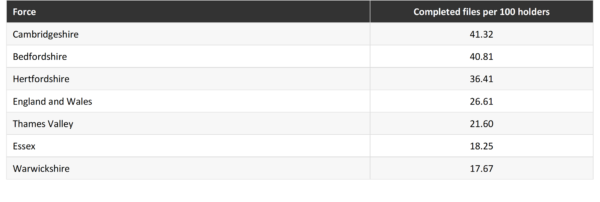
BCH occupies all three leading positions among forces with substantial holder populations. Combined, its output rose from 29.94 to 39.47 files per 100 holders. City of London records 40.00, but that is only 12 completions against 30 holders.
There is another BCH effect here. Of the national increase of 2,048 completed files, 1,930 came from BCH. That is 94.2%. Across the other 40 forces, completions increased by just 118, or 0.1%.
New Applicants
A good overall figure can conceal a very poor service for new applicants.
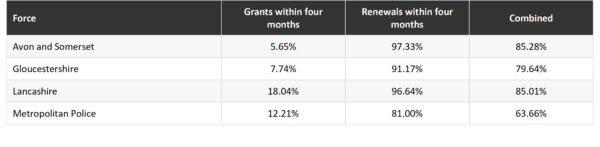
Avon & Somerset exceeds the 80% aspiration overall, yet more than 94% of its completed grants took longer than four months. Northumbria has the lowest grant figure, at 4.20%.
Across all 43 forces, 29 completed fewer than half their grants within four months. Seventeen completed fewer than a quarter. Only eight reached 80%.
Derbyshire leads grant timeliness at 98.17%, followed by Cheshire at 97.30% and Cumbria at 96.52%. Wiltshire and West Yorkshire made substantial improvements, while Lincolnshire and Thames Valley recorded substantial falls.
There is a qualification worth remembering. Clearing old applications can reduce a force’s four-month percentage even while it makes useful progress. These percentages describe completed grants; they do not include everyone still waiting.
Reading the Figures Fairly
The measures all belong together. High output does not guarantee fast processing. A fast headline does not mean new applicants receive the same service as renewals. Neither a high nor a low refusal count establishes the quality of decisions.
Recording practices also matter. Late entry of an application can distort turnaround measures if the recorded receipt date does not reflect actual receipt. These figures alone cannot establish deliberate manipulation by any force.
The guidance refers to the preceding 12 months to 8 October 2026, while the force dashboards display 1 October 2025 to 30 September 2026. Some measures are snapshots at report production. That is another reason to describe these as release-to-release comparisons and avoid assuming perfectly aligned cutoffs.
The message is straightforward: the national total is only the start of the story. Give credit for improvement, examine the places falling behind, and keep asking what the numbers mean for the people waiting.
Sources and Corrections
Source data: NPCC Firearms Licensing 2026/27 Quarter 2, guidance and headline table on pages 2–3 and individual force panels on pages 4–25. National ratios are calculated from summed counts; joint-team ratios use combined numerators and denominators.
Full Q2 release: https://www.npcc.police.uk/SysSiteAssets/media/downloads/publications/publications-log/operations/2026/2026-27-q2-firearms-licensing-data.pdf
We welcome challenges, corrections and queries at info@firearmslicensing.net. Any confirmed errors will be corrected publicly.
Full Force Comparisons
Permit and adverse-decision columns are per 1,000 holders. Output is completed files per 100 holders. Grant timeliness is the percentage of completed grants dealt with within four months.
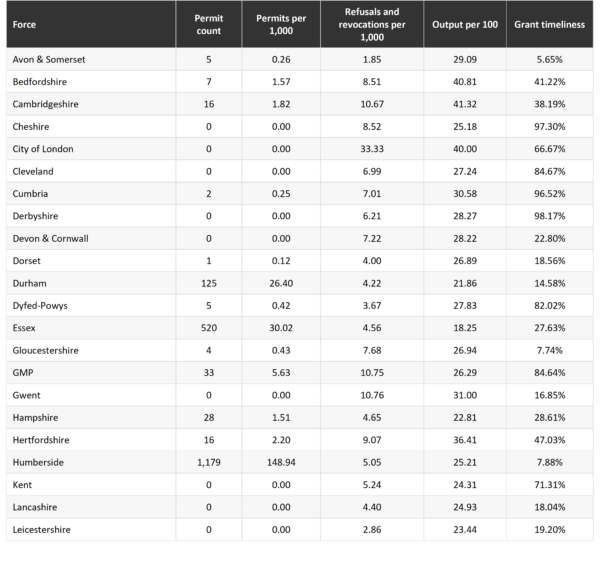
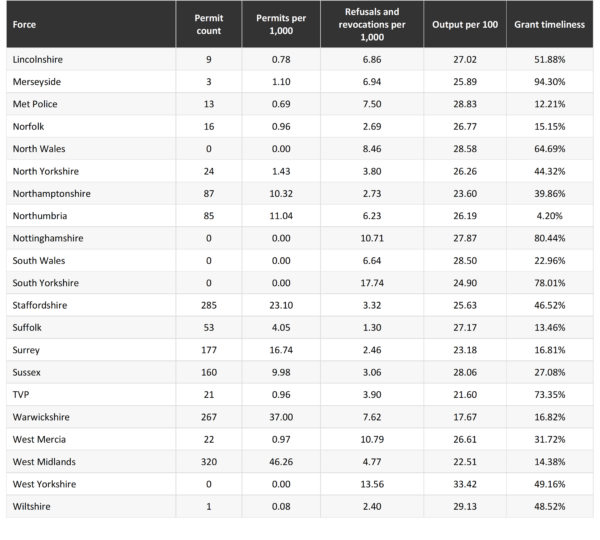
Counts and ratios describe recorded activity. They do not establish individual risk, decision quality or the experience of applications still awaiting completion.
City of London has only 30 recorded holders, making its ratios especially sensitive to single cases.