Introduction
Firearms licensing performance doesn’t grab your attention but it quietly shapes the stability of the entire shooting sector. When forces fall behind, clubs feel the pressure, certificate holders lose confidence and organisations end up spending more time dealing with licensing problems than developing the sport.
It isn’t glamorous, but it matters and it matters more now than ever.
For years, the data behind firearms licensing has been difficult to access, inconsistently presented and in some cases fundamentally flawed. We’ve challenged the National Police Chief’s Council (NPCC) on these issues before, particularly around the way forces report timeliness but little has changed. The published figures still allow forces to appear more efficient than they really are – for example by delaying the point at which applications are entered onto NFLMS or by marking certificates as granted before they are actually issued. These practices distort the picture and make it harder for the shooting community to understand what is really happening.
And yet, despite these flaws, this is the first time that this level of information has been made publicly available. That alone is a step in the right direction. Transparency in firearms licensing has never been more important and even imperfect data can reveal meaningful patterns when analysed properly.
This article looks beyond the headline SLA figures and focuses instead on the measures that genuinely reflect operational performance: true productivity, revocation and refusal activity, and temporary permit usage. When viewed over time, these indicators show a system that is becoming increasingly uneven with some forces performing exceptionally well and others struggling with delays, backlogs and inconsistent decision‑making.
Understanding these trends isn’t just an administrative exercise. It’s about fairness, confidence and the long‑term health of shooting in the UK.
And that’s why it’s worth paying attention.
If you’re hungry for more detail check out:
Behind the Numbers 1 and 2 via these links –
At a Glance
In the last 18 months:
Certificate Holders – We started with 506,343 and at last count now have 476,079. That’s a loss of 30,264.
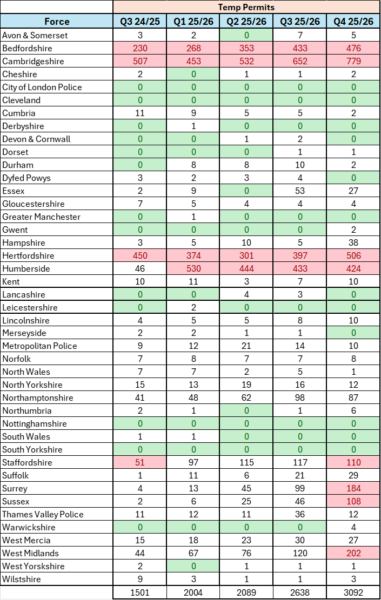
Temporary Permits – We started with 1,501 and at last count now have 3,092. That’s double and shows the strain the system is under.
Across Q4 25/26:
- The same forces repeatedly appear in the top group across productivity and low permit usage (Cheshire, Lincolnshire, Cumbria, Derbyshire, Nottinghamshire).
- The same forces repeatedly appear in the bottom group (Bedfordshire, Cambridgeshire, Hertfordshire, Humberside, Surrey, Sussex, West Yorkshire).
- Forces who show high usage of their refusal and revocation powers (Devon & Cornwall, West Mercia, South Yorkshire) remain consistently high.
- Temporary permit usage is the clearest indicator of stress and the Q4 data reinforces that pattern.
What all the numbers tell us is that UK firearms licensing is not a single system; it’s a patchwork of very different local realities. Some forces are delivering consistent, high‑quality work, while others are struggling with delays, backlogs, and heavy reliance on temporary permits.
True productivity varies dramatically and the published service level agreement (SLA) figures often mask deeper workflow problems.
Revocations and refusals remain low nationally, but intervention rates differ sharply between forces, reflecting local policy rather than national direction.
Overall, the system is stable in parts, fragile in others and increasingly defined by where you live rather than by national standards.
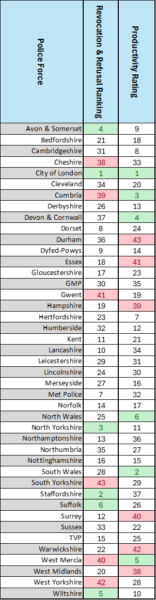
Q4 2025/26 – Where does your Force rank?
The following image is not perfect but it is designed to enable the average interested shooter to look at their Force and see what their performance is like in comparison to others.
Each Force is ranked from 1 to 43.
For revocation and refusal.
Ranking 1 is the area you are least likely to be refused / revoked.
Ranking 43 is the area where you are most likely to be refused / revoked.
Rank 43 is owned by South Yorkshire where you are almost 18 times more likely to be refused or revoked than if you lived in Staffordshire.
High rates do not necessarily indicate poor practice but it should ask the question – Is the shooting community of South Yorkshire really that different to the shooting community of Staffordshire?
For productivity
Ranking 1 is the Force that completes the most applications per year (Relative to their total number of certificate holders)
Ranking 43 is the Force that completes the least.
As a Force South Wales is almost twice as efficient as Durham.
References:
To see the data in full please visit –
https://www.npcc.police.uk/publications/All-publications/
and look in “Operations Coordination Committee”
Temporary Permits – Change Over Time
Transparency is not a luxury. It’s a duty.