Install on your iOS device:
Tap then "Add to Home Screen"
  • SUPPORTING RESPONSIBLE SHOOTING | Call us today:  07586 194458

statistics

Behind the Numbers 3

Behind the Numbers 3 2560 1708 Vicky Downs

Introduction

Firearms licensing performance doesn’t grab your attention but it quietly shapes the stability of the entire shooting sector. When forces fall behind, clubs feel the pressure, certificate holders lose confidence and organisations end up spending more time dealing with licensing problems than developing the sport.

It isn’t glamorous, but it matters and it matters more now than ever.

For years, the data behind firearms licensing has been difficult to access, inconsistently presented and in some cases fundamentally flawed. We’ve challenged the National Police Chief’s Council (NPCC) on these issues before, particularly around the way forces report timeliness but little has changed. The published figures still allow forces to appear more efficient than they really are – for example by delaying the point at which applications are entered onto NFLMS or by marking certificates as granted before they are actually issued. These practices distort the picture and make it harder for the shooting community to understand what is really happening.

And yet, despite these flaws, this is the first time that this level of information has been made publicly available. That alone is a step in the right direction. Transparency in firearms licensing has never been more important and even imperfect data can reveal meaningful patterns when analysed properly.

This article looks beyond the headline SLA figures and focuses instead on the measures that genuinely reflect operational performance: true productivity, revocation and refusal activity, and temporary permit usage. When viewed over time, these indicators show a system that is becoming increasingly uneven with some forces performing exceptionally well and others struggling with delays, backlogs and inconsistent decision‑making.

Understanding these trends isn’t just an administrative exercise. It’s about fairness, confidence and the long‑term health of shooting in the UK.

And that’s why it’s worth paying attention.

If you’re hungry for more detail check out:

Behind the Numbers 1 and 2 via these links –

Behind the Numbers

Behind the Numbers 2

At a Glance

In the last 18 months:

Certificate Holders – We started with 506,343 and at last count now have 476,079. That’s a loss of 30,264.

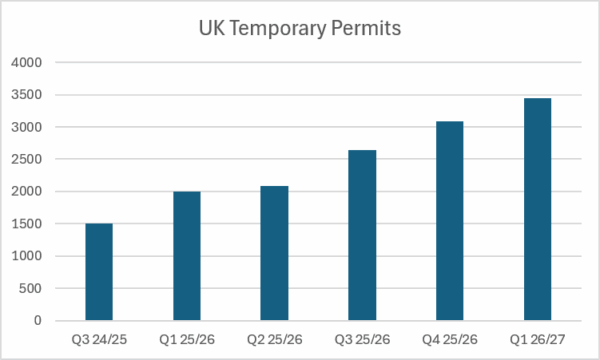
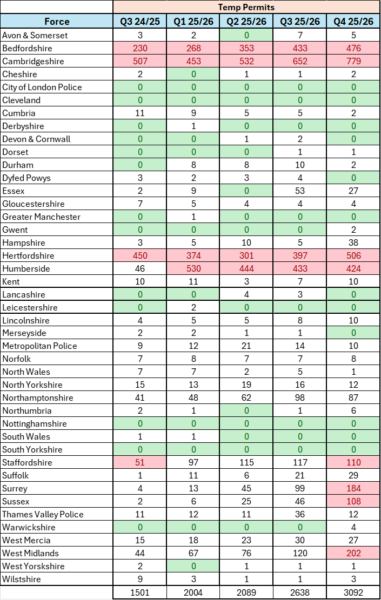
Temporary Permits – We started with 1,501 and at last count now have 3,092. That’s double and shows the strain the system is under.

Across Q4 25/26:

  • The same forces repeatedly appear in the top group across productivity and low permit usage (Cheshire, Lincolnshire, Cumbria, Derbyshire, Nottinghamshire).
  • The same forces repeatedly appear in the bottom group (Bedfordshire, Cambridgeshire, Hertfordshire, Humberside, Surrey, Sussex, West Yorkshire).
  • Forces who show high usage of their refusal and revocation powers (Devon & Cornwall, West Mercia, South Yorkshire) remain consistently high.
  • Temporary permit usage is the clearest indicator of stress and the Q4 data reinforces that pattern.

What all the numbers tell us is that UK firearms licensing is not a single system; it’s a patchwork of very different local realities. Some forces are delivering consistent, high‑quality work, while others are struggling with delays, backlogs, and heavy reliance on temporary permits.

True productivity varies dramatically and the published service level agreement (SLA) figures often mask deeper workflow problems.

Revocations and refusals remain low nationally, but intervention rates differ sharply between forces, reflecting local policy rather than national direction.

Overall, the system is stable in parts, fragile in others and increasingly defined by where you live rather than by national standards.

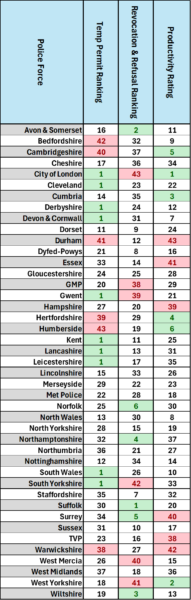
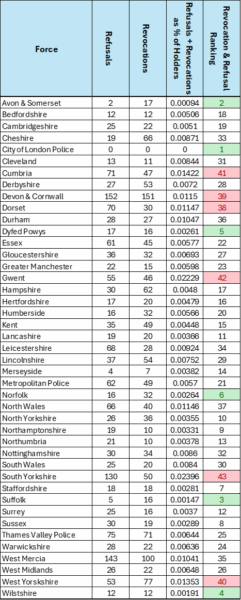
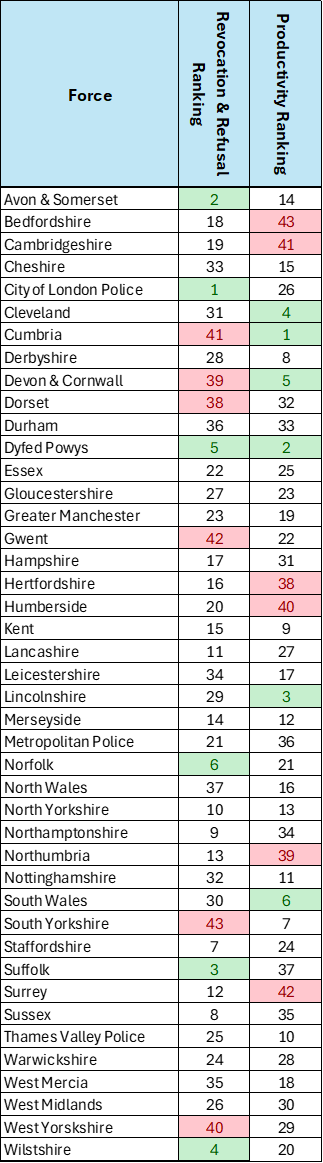
Q4 2025/26 – Where does your Force rank?

The following image is not perfect but it is designed to enable the average interested shooter to look at their Force and see what their performance is like in comparison to others.

Each Force is ranked from 1 to 43.

For revocation and refusal.

Ranking 1 is the area you are least likely to be refused / revoked.

Ranking 43 is the area where you are most likely to be refused / revoked.

Rank 43 is owned by South Yorkshire where you are almost 18 times more likely to be refused or revoked than if you lived in Staffordshire.

High rates do not necessarily indicate poor practice but it should ask the question – Is the shooting community of South Yorkshire really that different to the shooting community of Staffordshire?

For productivity

Ranking 1 is the Force that completes the most applications per year (Relative to their total number of certificate holders)

Ranking 43 is the Force that completes the least.

As a Force South Wales is almost twice as efficient as Durham.

References:

To see the data in full please visit –

https://www.npcc.police.uk/publications/All-publications/

and look in “Operations Coordination Committee”

Temporary Permits – Change Over Time

Transparency is not a luxury. It’s a duty.

Behind the Numbers 2

Behind the Numbers 2 2560 1708 Chris Downs

Introduction

There are lies, damned lies and statistics… but credible national information on firearms licensing is vital for the shooting community.

This is especially important when:

  • Licensing Fees have doubled – What are we getting for the extra money?
  • Backlogs are widespread and these delays threaten the future of the sport.
  • Numbers refused / revoked are at the highest levels since records began.

Previously, I have been critical on the available information. The first article in this series can be found via this link – https://firearmslicensing.net/behind-the-numbers/

Following this I wrote to the National Police Chief’s Council lead raising my concerns and received this reply on 17th August 2025:

what we will be doing with the recent end of July data capture to ensure it can be interpreted by anyone wanting to understand their local firearms licensing performance and compare this nationally.

This updated information can be found via these links:

https://www.npcc.police.uk/SysSiteAssets/media/downloads/publications/publications-log/operations/2025/firearms-licensing-2526-q1-headlines.pdf

https://www.npcc.police.uk/SysSiteAssets/media/downloads/publications/publications-log/operations/2025/firearms-licensing-2526-q2-headlines.pdf

In this article, which will be regularly updated, I walk you through my assessment of the figures provided step-by-step. If numbers aren’t for you then skip to “The End Result” of each section to see the final conclusions.

If viewing on a mobile device please note – All images will be available via the gallery at the bottom of this article which will make them easier to read.

Please note– I am not a statistician and errors can be made. The following is presented in good faith and any required corrections that are highlighted will be addressed and apologies offered if necessary.

Chapter 1 – Complete in 4 months

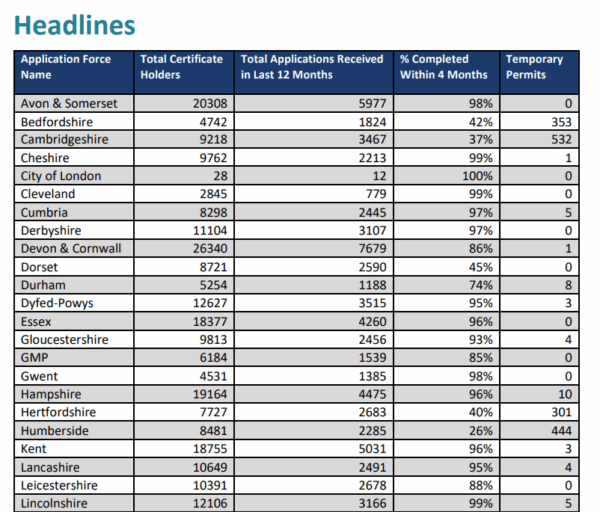
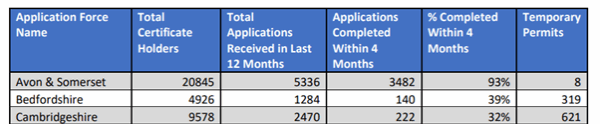
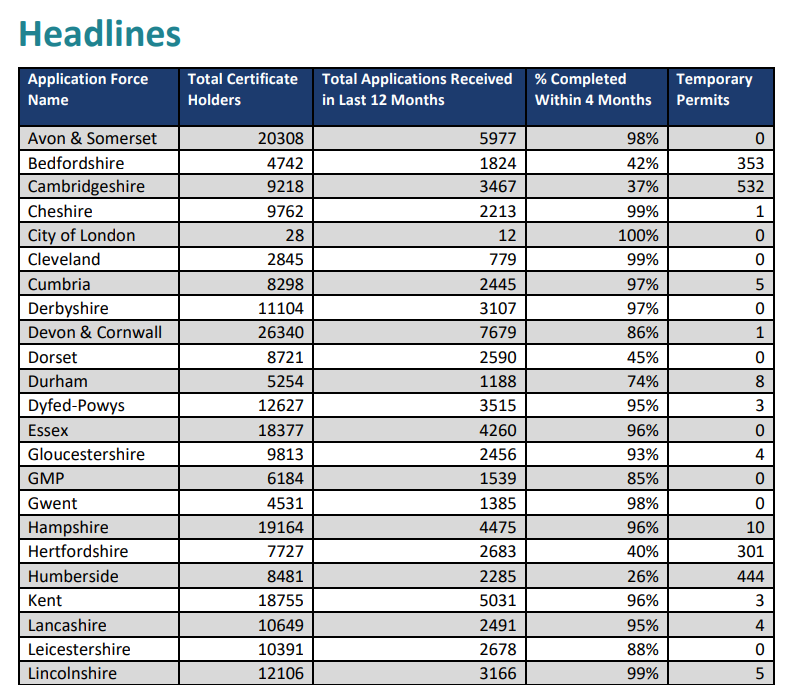
The “Headlines” at the start of the documents look like this.

It’s usual to present key information at the start of a document (not everyone likes numbers as much as I do!) but are they the right numbers?

It’s very natural to read numbers presented next to each other as being linked together. The column “Total Applications Received in last 12 months” and “% Completed Within 4 Months” are right next to each other.

So looking at Bedfordshire we see 1,824 application have been received and 42% completed within 4 months but what does that tell us? Not what we first think…

The Guidance Notes (See below) make it clear that the “completed in 4 months” percentage is not a percentage of all the applications received but rather a percentage of those received and completed within 12 months.

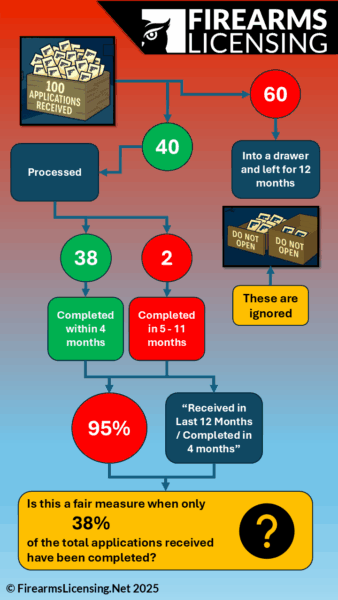
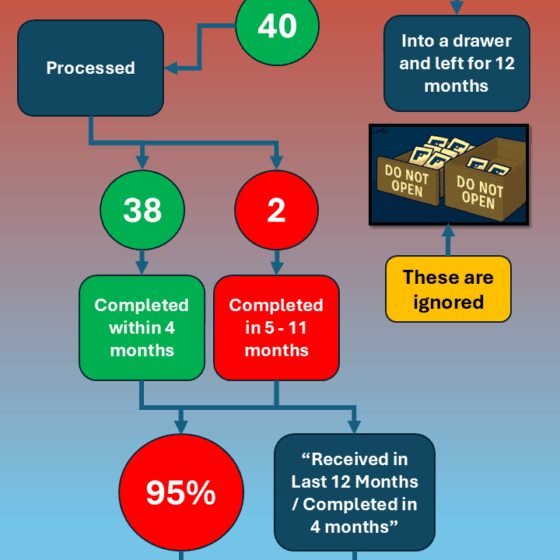
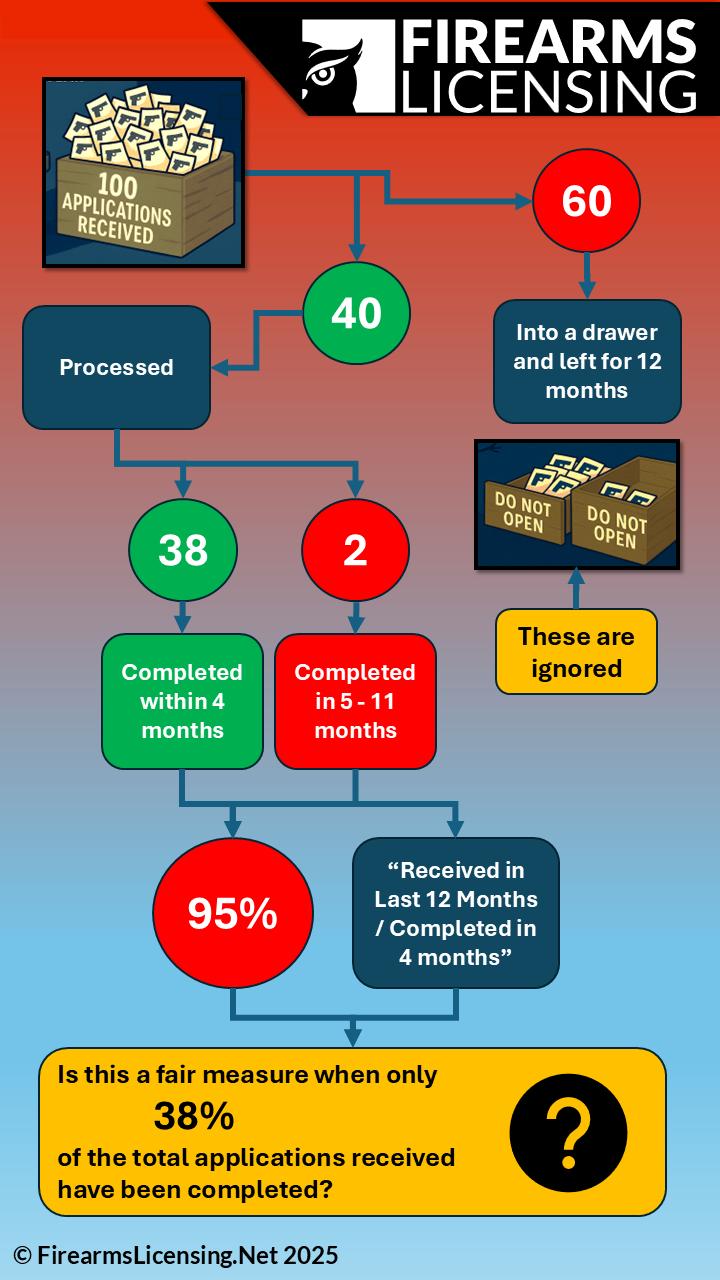
It’s not easy to understand why these are presented in this was but it can seriously distort your perception of what is going on. To try and explain the risks with this information as clearly as possible I have created this fictitious example.

I receive 100 applications and put 60 into a drawer – I do nothing with these. The remaining 40 I work on and complete 38 within 4 months. The remaining 2 take slightly longer. Of those 40 applications I have processed 95% (38/40 = 95%).

But, in reality only 38% of all applications received have been completed within 4 months.

1 – The Detail

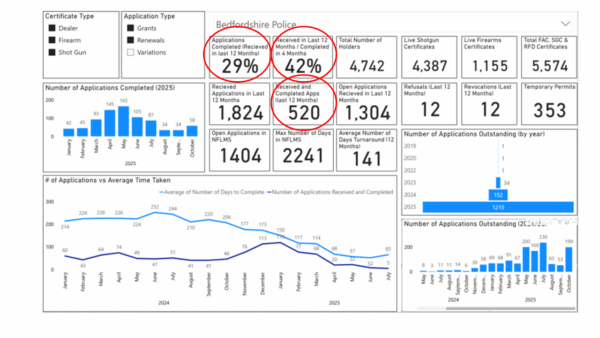
Going back to Bedfordshire this means that if we want to know how many of the applications were completed in 4 months as a percentage of all applications received we need to look closer.

  • 1,824 applications received in the last 12 months. 520 of those were completed.
  • Of those 520 completed 42% were completed within 4 months = 218
  • 218 is 12% of 1,824

1 – The End Result

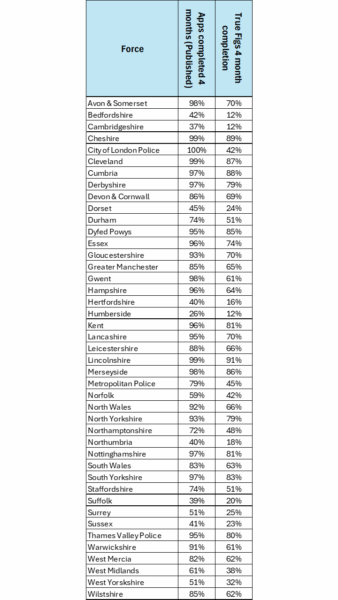
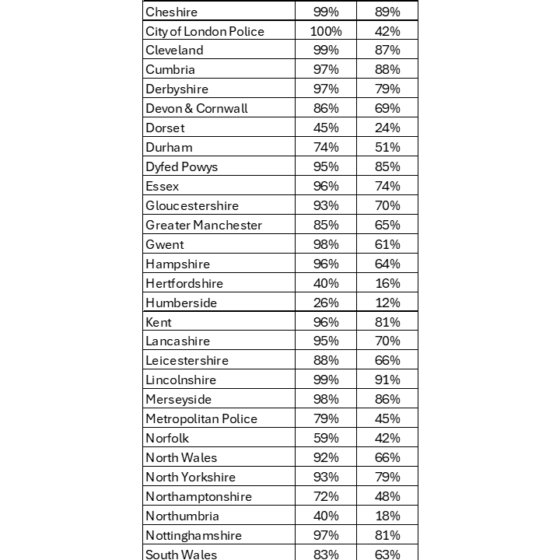
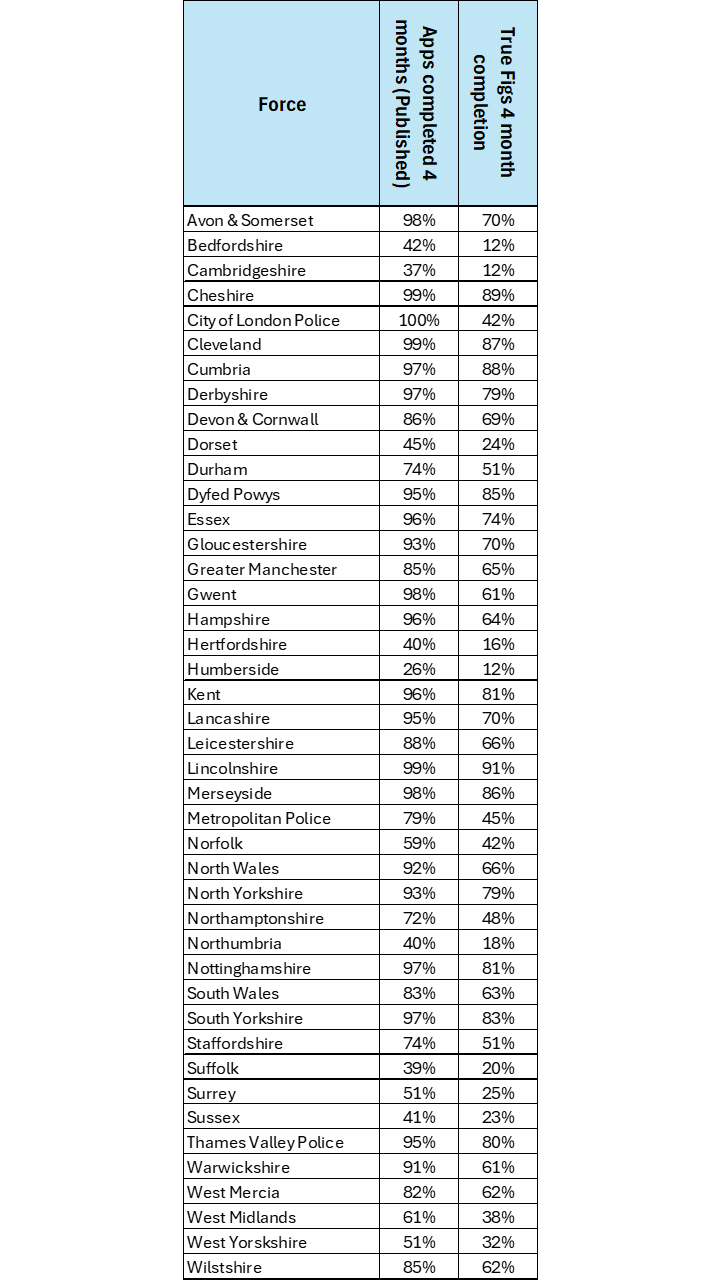
If we follow this methodology then the results look very different and arguably give a much more accurate idea of performance in this area.

If the image does not display well on the screen go down to the bottom of the article and view it via the gallery.

Across the majority of police forces we now see a very different picture emerging. Taking Gwent as an example we go from 98% (which seems very impressive) to 61%.

Why 4 months?- There is actually some science and background as to why this is important. The Firearms Act 1968 gives those applications received more than 8 weeks before expiry an automatic extension of a further 8 weeks. So 16 weeks in total (4 months ish) is the expected processing time contained in the primary source of law in this area.

Chapter 2 – Productivity

Firearms licensing is a complex system with many variables. The detailed information presented on each individual force is useful but going back to the National Police Chief’s Council (NPCC) earlier comment on what their ambition was for these statistics:

ensure it can be interpreted by anyone wanting to understand their local firearms licensing performance and compare this nationally.

This is what the detailed force data looks like. Does it achieve their aim and allow anyone to understand and compare? 

2 – The Detail

The balance between making something simple enough to be useful and acknowledging the complexities is difficult and no single measure will ever be perfect.

The other complication is that no two forces are working in the same way and the data, particularly on timeliness, is open to abuse. If a force chooses to leave a new application for a month before placing it onto the system or grant the certificate as soon as it’s received the system will not recognise this and the impact on “performance” will be significant.

The NPCC have set out their expectation below but all the evidence suggests that data manipulation remains widespread.

NPCC Firearms Licensing expects all forces to place firearm, shotgun and registered firearms dealer (RFD) grant and renewal applications onto NFLMS within a brief time of receipt to ensure accurate recording of data. Equally, NFLMS should only be updated to show ‘granted’ when the new certificate is ready for print and onward forwarding to the applicant.

To try to solve these issues I have kept it simple and just considered:

  • Certificate Holders
  • Applications received and completed in last 12 months

This allows us to make a comparison of actual work completed against the numbers of Certificate Holders (the size of the unit).

As a very rough rule of thumb if 20% of applications are completed in one year then the force is managing to keep pace with their existing numbers of certificate holders.

2 – The End Result

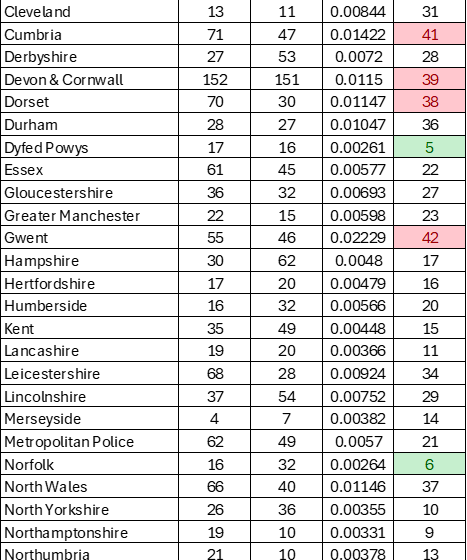
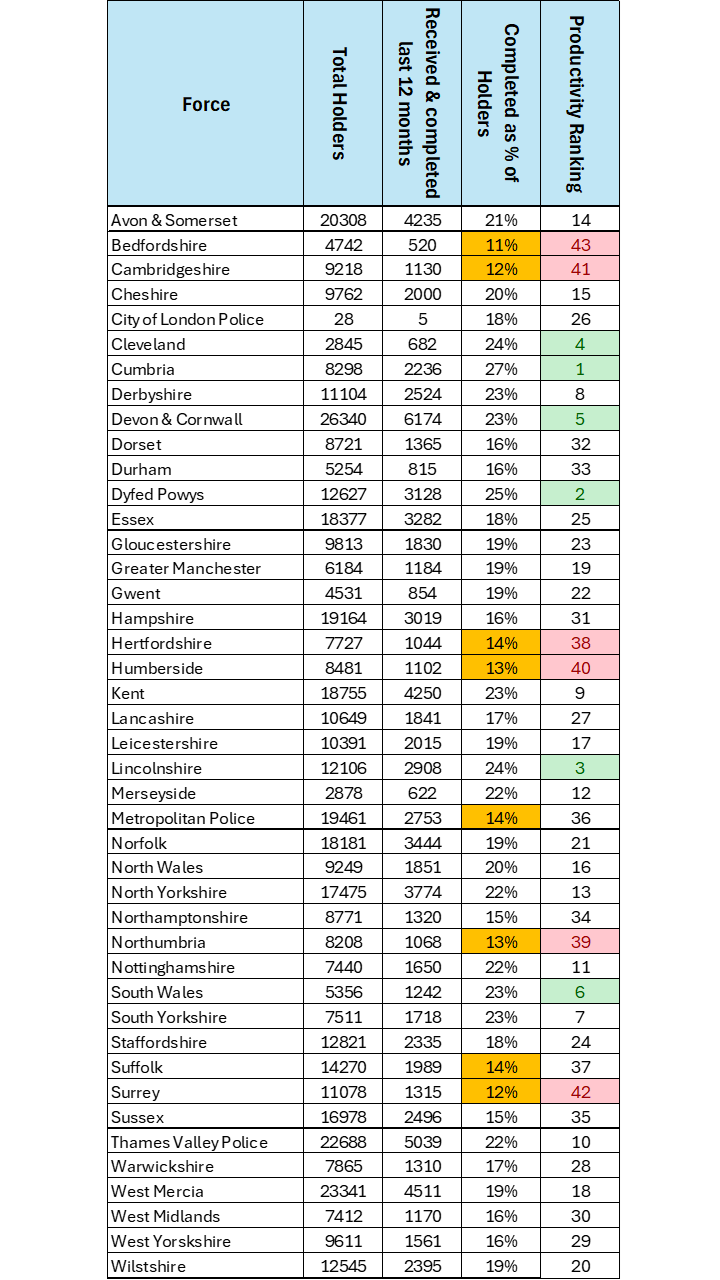
Using the approach detailed above I have ranked each force on this basis to enable comment on productivity and comparison between forces.

The yellow highlight shows a percentage which is lower than would be expected and the red and green show top and bottom 15% respectively.

If the image does not display well on the screen go down to the bottom of the article and view it via the gallery.

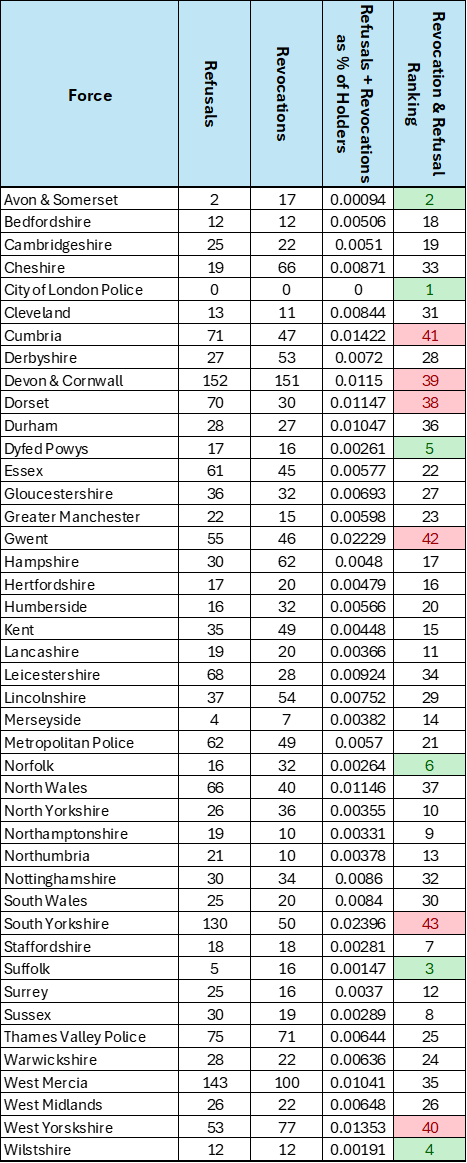
Chapter 3 – Appetite for Revocation or Refusal

Revocations and refusals are legal means by which a force can remove an existing certificate or deny the issue of a new certificate. Both of these measures have a right of appeal to your local Crown Court. However, in practice this is infrequently used because of the prohibitive costs involved. For someone challenging a police decision:

  • The best-case scenario is a £6,000 (approx.) legal bill and the return of your firearms.
  • The worst case scenario is a £12,000 – 15,000 legal bill and you remain without your guns.

This is because the person bringing the action is responsible for their own legal bill if they win or usually have to pay for police costs if they lose.

There are a number of factors that can make you more likely to find yourself in this situation and probably the most significant is your postcode!

Someone in South Yorkshire is 25 times more likely to find themselves in this situation than if they lived in Avon & Somerset.

Therefore, the rate of revocations and refusals issued by a force is important information for a shooter.

3 – The Detail

It would be unfair to use the numbers of revocations and refusals on their own because that does not take into account the size of the force and numbers of certificate holders.

It would be reasonable to assume that force A with twice the numbers of holders of force B might reasonably issue twice the numbers of revocations as a result.

To give some clearer idea of individual forces approach in this area I have added together the number of revocations and refusals issued in a yearly period and divided this by the total number of certificate holders. This gives a percentage that we can use to rank forces and give a clearer idea of what is going on in this area.

3 – The End Result


Chapter 4 – Trends

1. Productivity Changes

  • Most forces show a decline in productivity from Q3 2024/25 to Q2 2025/26. During the three periods the total numbers of files completed across the UK starts at 115,500, then goes down to 100,500 and finishes on 91,700. That’s an overall decrease of 20% which is highly concerning and begun before the latest version of Statutory Guidance was issued.
  • Several forces, such as Cumbria and Dyfed Powys, have managed to maintain or slightly improve productivity over the period.
  • Surrey: Experienced the largest drop in productivity from 3,950 (which seems very high) to 1,315
  • Cumbria: Shows consistently high productivity and even a slight increase, bucking the national trend. Cumbria is 2.5 times more productive than the lowest performing Force Bedfordshire.

2. Holders Change

  • The number of certificate holders is decreasing across all forces. In total 17,779 Certificate Holders have been lost since
  • The largest reductions are seen in, Metropolitan Police (-1,479), Devon & Cornwall (-1,041), and Norfolk (-1,009) have the largest reductions.

3. Refusals and Revocations

  • The percentage of refusals and revocations as a proportion of holders remains relatively stable across all periods.
  • The highest proportion of refusals and revocations are seen in South Yorkshire, Gwent and Cumbria.
  • The disproportionate nature of the refusals and revocations rate continues to be seen. A Certificate Holder’s postcode can make them over 25 times more likely to be revoked (South Yorskshire v Avon & Somerset).

4. Temporary Permits

  • The number of temporary permits issued has increased from 1,501 to 2,089. This is a 38% increase and is a clear warning of a system under significant strain.
  • The biggest increases in numbers of permits are seen in Humberside (by a huge margin) followed by Bedfordshire. Several smaller increases are seen across Forces such as Surrey, Suffolk and Staffordshire.

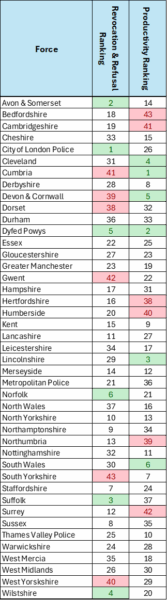
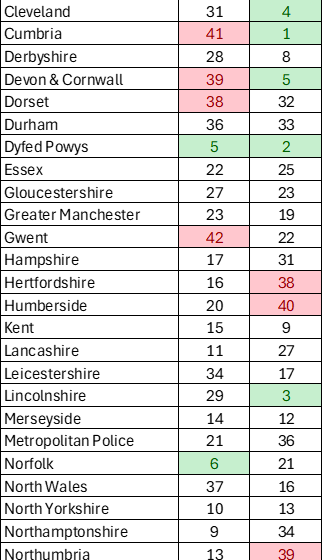
Summary Chart –

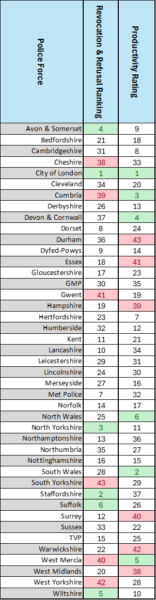
The following chart summarises my assessment of where each Force ranks according to Productivity and Revocation & Refusals. If this does not display on your mobile device please open it via the gallery below.

In Conclusion:

The current presentation of firearms licensing statistics reveals a troubling lack of clarity, consistency, and methodological transparency from the police. These figures are not just confusing; they risk misleading stakeholders and undermining public trust.

Under the UK Statistics Authority’s Code of Practice for Statistics, official data must uphold the principles of trustworthiness, quality, and value. That means clear definitions, robust methods, and relevance to users.

Firearms licensing affects public safety, individual rights, and operational accountability. If we are to govern it fairly, the data must meet the same standards of integrity we expect from the system itself.

Transparency is not a luxury. It’s a duty.


Gallery – Chapter 1


Gallery – Chapter 2


Gallery – Chapter 3


Gallery – Chapter 4

Behind the Numbers

Behind the Numbers 2560 1708 Chris Downs

Introduction

This piece explores the troubling inconsistencies and lack of transparency in firearms licensing statistics across England and Wales.

Drawing on recent data releases, I highlight how misleading figures can obscure operational realities.

This article considers 3 key Data Sources:

  1. National Police Chief’s Council
  2. BASC Annual report (Police figures within)
  3. Home Office Firearms Licensing Statistics

National Police Chiefs Council

Firearms Licensing 2024/25 Quarter 4 Headlines (1 January 2025 to 31 March 2025)

This data can be found via this link:

https://www.npcc.police.uk/SysSiteAssets/media/downloads/publications/firearms-licensing-q4-headlines.pdf

Unfortunately, this actually gives us very little useful information, particularly as it is issued with no explanatory notes as to how the figures are calculated. As a result, there are more questions than answers.

If we take a closer look at the first few Forces.

Avon and Somerset

The first 3 columns make sense. There’s a five year cycle of renewals so we might expect 4,500 ish renewal applications to be submitted in a year and the rest could be mostly made up of grants and variations.

At first glance I might be impressed that 93% of applications were completed within 4 months, as indicated in Column 5. However, if I take the numbers from columns 3 and 4 my sums look like this:

3483 / 5336 = 0.65 which translates to 65%.

So, something else must be going on here. It’s very natural to read columns of numbers and assume that they relate to each other, but it doesn’t look like this is the case here.

Perhaps the numbers mean that of the 5,336 applications received in the last 12 months 3,482 have been completed within 4 months of receipt and that this represents 93% of all applications received during the 3 month period that this information covers. In all honesty it’s impossible to say for certain.

I have sent an email (30Jul’25) requesting some further explanation from the National Police Chief’s Council. This email has been acknowledged but no details has been provided yet.

Bedfordshire

Moving these issues to one side the next Force up is Bedfordshire who according to this data have completed 140 applications within 4 months which is a reported 39% of the total.

Bedfordshire is part of a Tri-Force Alliance with Cambridgeshire and Hertfordshire, so direct comparisons are perhaps unfair but gives strong indication that the excessive delays in this Force are unlikely to be resolved soon.

BASC – Performance Report

The Performance of Police Firearms Licensing Departments in England and Wales 2025

This document can be found via this link – https://basc.org.uk/basc-publishes-most-comprehensive-firearms-licensing-report-to-date/

In this report BASC have completed the most complete report on Firearms Licensing to date, which is summarised on page 4 of the document.

To be very clear – The following observations are not intended as a criticism of BASC. The data in question has been provided by police from the National Firearms Licensing Management System (NFLMS).

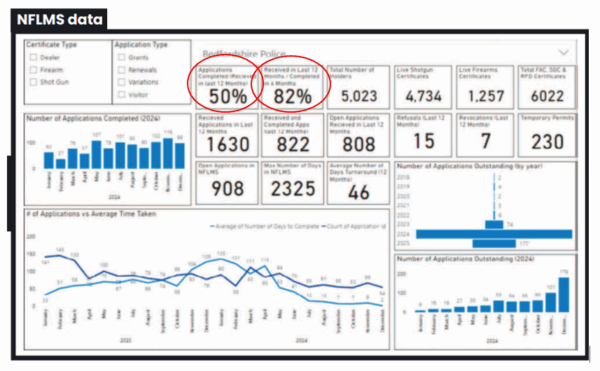
Each police force receives an individual section which includes other data obtained from the police via Freedom of Information Act (FOI) requests. This police data is shown below:

On the police data I have highlighted two key figures.

  1. Applications Completed (Received within last 12 months) – 50%
  2. Received in last 12 months / Completed in 4 months – 82%

The figures appear contradictory. If 50% of applications are completed overall, how can 82% be completed within four months? Without explanatory notes, these statistics risk misleading stakeholders.

I have sent an email (30Jul’25) requesting some further explanation from the National Police Chief’s Council. This email has been acknowledged but no details has been provided yet.

Home Office Statistics

The official Home Office Statistics are released on an annual basis, compiled by a named Statistician and comply with guidelines set down by the Office for Statistics Regulation.

They can be found via this link:

https://www.gov.uk/government/statistics/firearm-and-shotgun-certificates-april-2024-to-march-2025/firearm-and-shotgun-certificates-april-2024-to-march-2025#:~:text=2.-,Summary%20of%20statistics,with%2031%20March%202024%20(495%2C798)

Within the summary text this report states:

“482,612 shotgun certificates on issue as at 31 March 2025, a 3% decrease (-13,186) compared with 31 March 2024 (495,798). This is the sixth consecutive year there has been a decrease and marks the lowest number of shotgun certificates on issue since comparable records began.”


“334 new applications for firearm certificates were refused (5%), a 19% decrease compared with the previous year (414) but the second highest number since comparable records began, following the introduction of the NFLMS in 2007”


“1,073 new applications for shotgun certificates were refused (7%), a similar number to the previous year (1,072) and the highest since comparable records began, following the introduction of the NFLMS in 2007”


Within this document you can find data tables which give specific detail on key information on firearms licensing broken down into individual Forces.

It is within this document that you can compare Forces and identify the serious differences within them.

For example:

During the course of 12 months – South Yorkshire consider 378 grant applications for shotgun certificates and refuse 77 of these.

During the same time period – North Yorkshire consider 550 grant applications for shotgun certificates and refuse only 9 of these.

These figures indicate that living South of the M62 makes you 12.5 times more likely to be refused than if you live on the North of it!

(Note – The Border between Forces isn’t that simple but illustrates the point)

In Conclusion:

The current presentation of firearms licensing statistics reveals a troubling lack of clarity, consistency, and methodological transparency from the police. These figures are not just confusing; they risk misleading stakeholders and undermining public trust.

Under the UK Statistics Authority’s Code of Practice for Statistics, official data must uphold the principles of trustworthiness, quality, and value. That means clear definitions, robust methods, and relevance to users.

Firearms licensing affects public safety, individual rights, and operational accountability. If we are to govern it fairly, the data must meet the same standards of integrity we expect from the system itself.

Transparency is not a luxury. It’s a duty.

Back to top